Notes before the project
1. opencv’s image grayscale conversion method
gray = cv2.cvtColor(“image”, cv2.COLOR_RGB2GRAY)
2. opencv detects image edges
Gaussian blur image
cv2.GaussianBlur(gray, (5, 5), 0)
Get the sharpened image
canny = cv2.Canny(blur, 50, 150)
3. use of the matplotlib plot image library
Project details
We start by getting an image of a frame from the live camera
Import the library
import cv2
import numpy as np
import matplotlib.pyplot as plt
Edge detection
Converts an image to grayscale and detects the edges of the image
def canny(image):
“””1. Grayscale conversion of an image”””
# Convert a frame into a grayscale image
gray = cv2.cvtColor(lane_image, cv2.COLOR_RGB2GRAY)
“””2. Detect image edges”””
#Gaussian blur image
blur = cv2.GaussianBlur(gray, (5, 5), 0)
#Get the sharpened image
canny = cv2.Canny(blur, 50, 150)
return canny
image = cv2.imread(‘1.jpg’)
lane_image = np.copy(image)
canny = canny(lane_image)
plt.imshow(canny)
plt.show()
Get the plot result
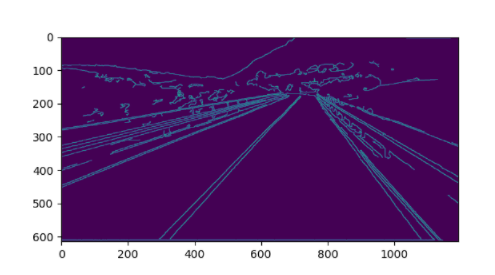
Since the Chinese lane runs along the right side, we can clearly see the digits of the X and Y axes in the plotted image, from position (400, 0) on the X axis to approximately (1100, 0) on the X axis is the width of the right lane, then we look at the digits of the Y axis, at approximately 150 is the end point of the right lane within our visual range, and since the distance from (400, 0) to ( 1100, 0) is 700px, so we can get the end point of the right lane in our visual range as (700, 150).
Based on the calculation of the above positions, we can arrive at a triangle in the right lane
def region_of_interest(image):
height = image.shape[0]
polygons = np.array([
[(400,height),(1100,height),(700,150)]
])
mask = np.zeros_like(image)
cv2.fillPoly(mask,polygons,255)
return mask
image = cv2.imread(‘1.jpg’)
lane_image = np.copy(image)
canny = canny(lane_image)
cv2.imshow(‘result’,region_of_interest(canny))
cv2.waitKey(0)
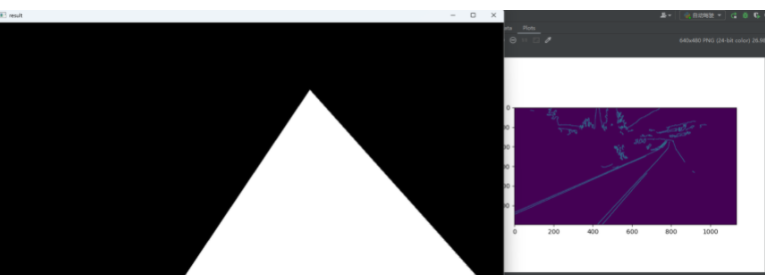
Derive the detection triangle
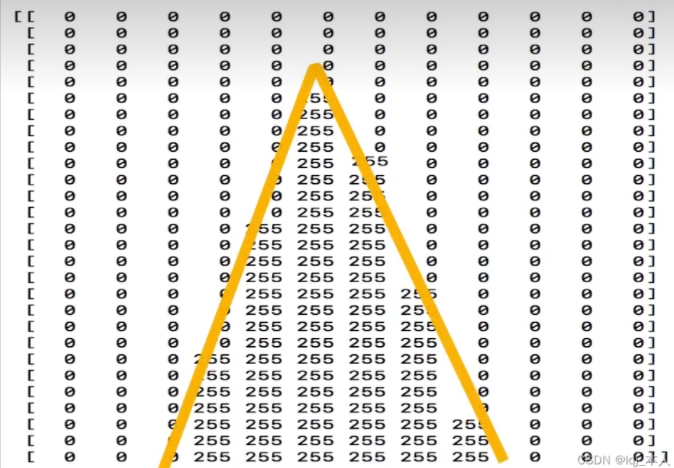
Generating a mask
Represent the detected image by 255 (white) and the surrounding area by 0 (black)
Sometimes the triangle is not exactly similar to the shape we see into the point to the left and right points, so we need to fine tune it ourselves
polygons = np.array([
[(400,height),(1200,height),(800,200)])
])
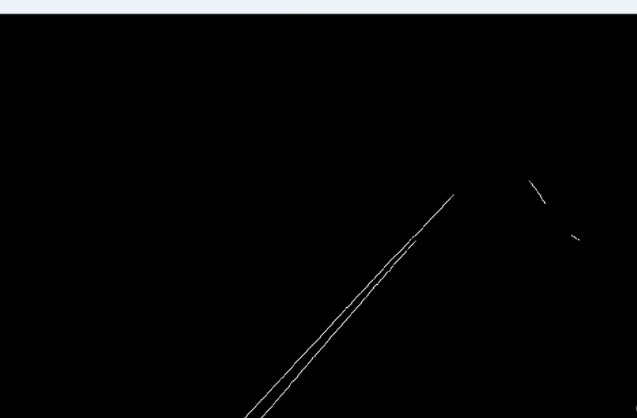
We can then crop our image with the right lane triangle
masked_image = cv2.bitwise_and(image,mask)
cropped_image = region_of_interest(canny)
cv2.imshow(‘result’,cropped_image)
Effect of edge detection and masking
Cropping the displayed image
Define the lane start position
def make_coordinates(image,line_parameters):
slope,intercept = line_parameters
print(image.shape)
y1 = image.shape[0]
y2 = int(y1*(3/5))
x1 = int((y1 – intercept)/slope)
x2 = int((y2 – intercept)/slope)
return np.array([x1,y1,x2,y2])
Straight line detection with the Hough transform
HoughLinesP is a function wrapped in Opencv, using the following parameters.
image: the input image, usually the image after canny edge detection
rho: the distance accuracy of the line segment in pixels
theta: the angular accuracy of the pixel in radians (np.pi/180 is more appropriate)
threshold: threshold for the accumulation of the Hough plane
minLineLength: the minimum length of the line segment (in pixels)
maxLineGap: maximum allowed break length
lines = cv2.HoughLinesP(cropped_image, 2, np.pi/180, 100, np.array([]), minLineLength=40, maxLineGap=5)
Draw the lanes
def display_lines(image,lines):
line_image = np.zeros_like(image)
if lines is not None:
for line in lines:
# print(line)
x1,y1,x2,y2 = line.reshape(4)
cv2.line(line_image,(x1,y1),(x2,y2),(255,100,10),10)
return line_image
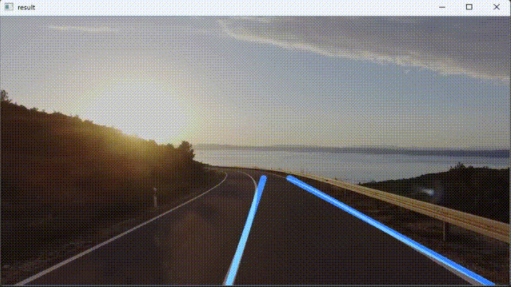
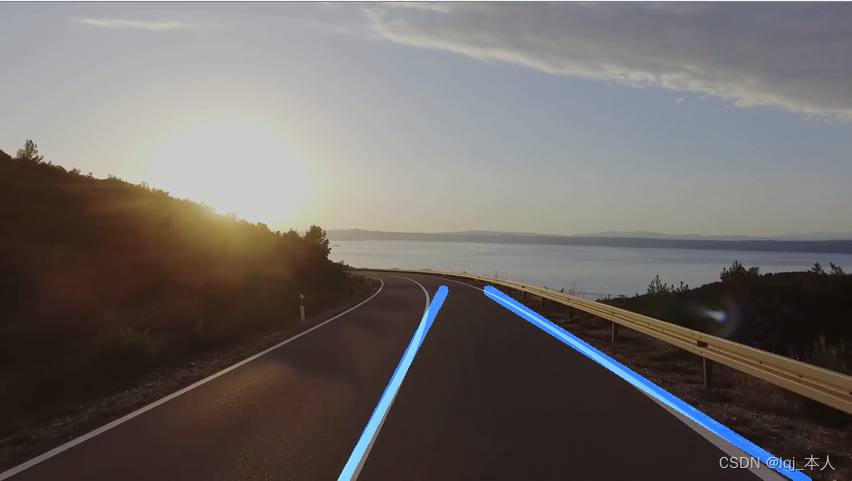
Effect image
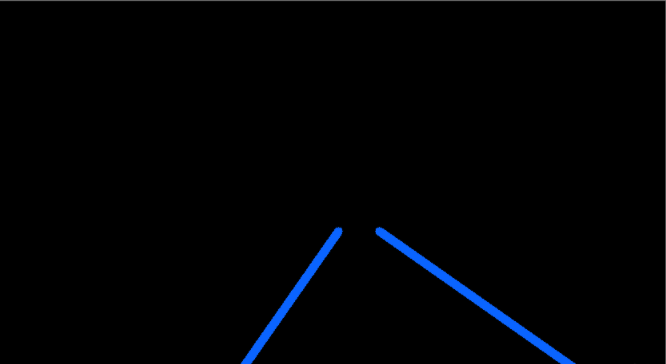
Image and lane mapping fusion
Position detection in the video stream
def average_slope_intercept(image,lines):
left_fit = []
right_fit = []
if lines is None:
return None
for line in lines:
x1,y1,x2,y2 = line.reshape(4)
parameters = np.polyfit((x1,x2),(y1,y2),1)
# print(parameters)
slope = parameters[0]
intercept = parameters[1]
if slope < 0:
left_fit.append((slope,intercept))
else:
right_fit.append((slope,intercept))
print(left_fit)
print(right_fit)
Print left and right position results
Full code
import cv2
import numpy as np
import matplotlib.pyplot as plt
def make_coordinates(image,line_parameters):
slope,intercept = line_parameters
print(image.shape)
y1 = image.shape[0]
y2 = int(y1*(3/5))
x1 = int((y1 – intercept)/slope)
x2 = int((y2 – intercept)/slope)
return np.array([x1,y1,x2,y2])
def average_slope_intercept(image,lines):
left_fit = []
right_fit = []
if lines is None:
return None
for line in lines:
x1,y1,x2,y2 = line.reshape(4)
parameters = np.polyfit((x1,x2),(y1,y2),1)
# print(parameters)
slope = parameters[0]
intercept = parameters[1]
if slope < 0:
left_fit.append((slope,intercept))
else:
right_fit.append((slope,intercept))
# print(left_fit)
# print(right_fit)
left_fit_average = np.average(left_fit,axis=0)
right_fit_average = np.average(right_fit,axis=0)
print(left_fit_average,’左’)
print(right_fit_average,’右’)
left_line = make_coordinates(image,left_fit_average)
right_line = make_coordinates(image,right_fit_average)
return np.array([left_line,right_line])
def canny(image):
“””1. Grayscale conversion of images”””
# Convert a frame of an image into a grayscale image
gray = cv2.cvtColor(image, cv2.COLOR_RGB2GRAY)
“””2. Detect image edges”””
#Gaussian blur the image
blur = cv2.GaussianBlur(gray, (5, 5), 0)
#Get the shrewd image
canny = cv2.Canny(blur, 50, 150)
return canny
#Each line is a two-dimensional array containing our line coordinates of the form [[x1,yl,x2,y2]]. These coordinates specify the parameters of the lines, and the spatial position of the lines relative to the image, ensuring they are placed in the correct position
def display_lines(image,lines):
line_image = np.zeros_like(image)
if lines is not None:
for line in lines:
# print(line)
x1,y1,x2,y2 = line.reshape(4)
cv2.line(line_image,(x1,y1),(x2,y2),(255,100,10),10)
return line_image
def region_of_interest(image):
height = image.shape[0]
polygons = np.array([
[(300,height),(650,height),(500,150)]
])
mask = np.zeros_like(image)
cv2.fillPoly(mask,polygons,255)
masked_image = cv2.bitwise_and(image,mask)
return masked_image
# image = cv2.imread(‘1.png’)
# lane_image = np.copy(image)
# canny_image = canny(lane_image)
# cropped_image = region_of_interest(canny_image)
# lines = cv2.HoughLinesP(cropped_image,2,np.pi/180,100,np.array([]),minLineLength=40,maxLineGap=5)
# averaged_lines = average_slope_intercept(lane_image,lines)
# line_image = display_lines(lane_image,averaged_lines)
# combo_image = cv2.addWeighted(lane_image,0.8,line_image,1,1)
# cv2.imshow(‘result’,combo_image)
# cv2.waitKey(0)
cap = cv2.VideoCapture(‘3.mp4’)
# try:
while cap.isOpened():
_,frame = cap.read()
canny_image = canny(frame)
cropped_image = region_of_interest(canny_image)
lines = cv2.HoughLinesP(cropped_image, 2, np.pi/180, 100, np.array([]), minLineLength=40, maxLineGap=5)
averaged_lines = average_slope_intercept(frame, lines)
line_image = display_lines(frame, averaged_lines)
combo_image = cv2.addWeighted(frame, 0.8, line_image, 1, 1)
# cv2.resizeWindow(“result”, 1080, 960);
cv2.imshow(‘result’, combo_image)
cv2.waitKey(10)